


BREED AVERAGES
![]() Non Parent
Non Parent
![]() Active Sires
Active Sires
![]() Active Dams
Active Dams
PERCENTILE RANK
![]() Non Parent
Non Parent
![]() Active Sires
Active Sires
![]() Active Dams
Active Dams
GENETIC TRENDS
![]() Genetic Trends Graphically
Genetic Trends Graphically
![]() Genetic Trends
Genetic Trends
![]() Trait Leaders
Trait Leaders
![]() Active Sires
Active Sires
![]() Young Sires
Young Sires
Over the past 40 years, EPDs have proven their effectiveness in changing beef cattle as breeders are better able to select superior animals. EPDs are especially effective in allowing breeders to compare their cattle to animals from other herds, a task not possible with regular phenotypes. The recent inclusion of genomics into the BBU EPDs, as well as the addition of calving ease EPDs, has enhanced a breeder’s ability to make superior selection decisions. The Spring 2022 Genetic Evaluation is now available at www.beefmasters.org. This summary compiles the massive amounts of data collected by Beefmaster breeders, as well as the more recently collected genomic results, into the best possible predictions of each animal’s genetic merit.
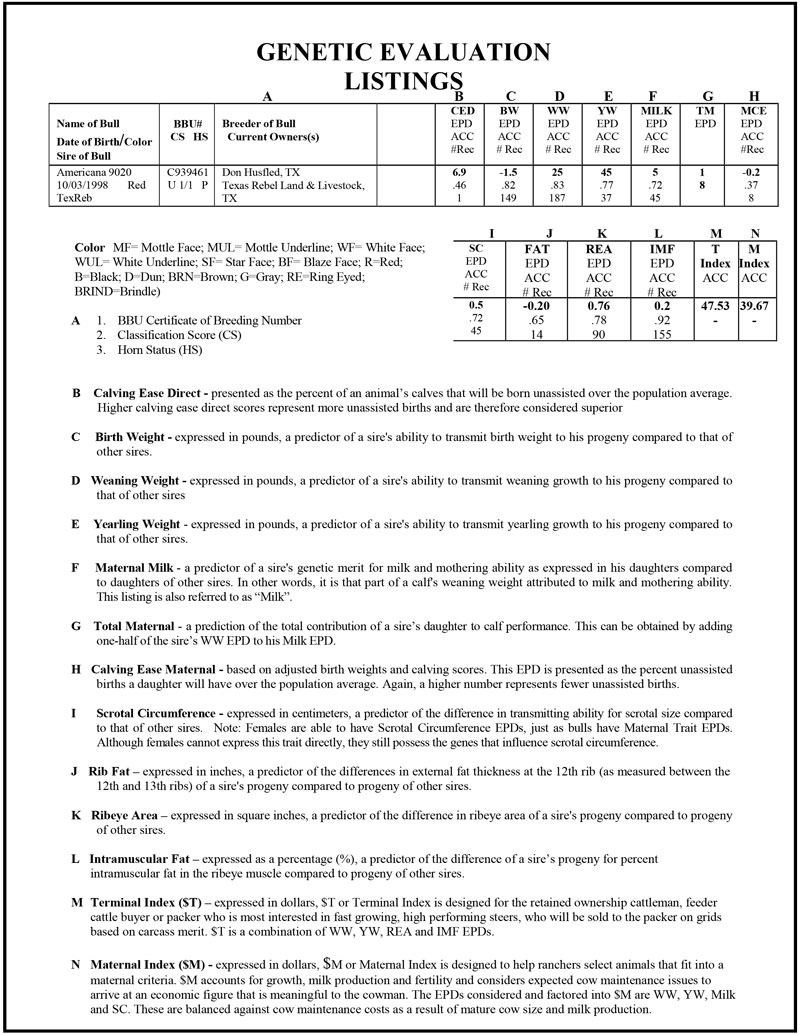
For an Active Sire to be published in the Genetic Evaluation, he must have an accuracy of 60% for weaning weight. Young Sires are bulls under five years of age (born after Jan 1, 2018). Young Sires must have an accuracy of 30% for weaning weight and a minimum of 10 progeny records. All information on all traits for Active and Young Sires has been printed, provided they have met accuracy requirements for weaning weight. Sires that have not had any offspring born in 2019, 2020 or 2021 are considered inactive sires and have been deleted from the Sire Summary. A list of trait leaders has also been included, presenting the top 15 sires for each trait with a minimum accuracy of 60% for that trait and at least 5 records for that trait (on growth traits only). Scrotal and scan trait leaders must have a minimum accuracy of 50% for that trait with no minimum record requirements.
Frequently Asked Questions
Q. My bull is not listed in the Genetic Evaluation. Why not?
A. Only bulls with progeny performance records in BBU Performance Programs are included in the published Genetic Evaluation. However, this does not ensure that a bull will be listed. The analysis is largely based on the relative differences between progeny records of sires within contemporary groups. For this reason, it is important to use more than one sire in your herd. It is also helpful to make semen available on your herd sires and encourage other BBU breeders to use them in their breeding programs.
Q. I did all of that and still don’t see my bull in the Genetic Evaluation. Why?
A. In order for any EPD to be included in the Genetic Evaluation, the accuracy for weaning weight must be at least .60 for Active Sires, or .30 for Young Sires. This accuracy value depends on the number of calves a bull has sired, the distribution of those calves in various herds, and the amount of pedigree information available on a bull. (Accuracy values on young sires will increase more dramatically when they are directly tested against proven, high accuracy sires as opposed to other young bulls).
Q. What happens to the EPD information on all of the bulls that did not meet requirements to be included in the Genetic Evaluation?
A. The BBU office has the EPD information for all of the bulls included in the Genetic Evaluation Analysis, as well as EPDs for females and for young bulls that have not yet sired calves. The owners of these cattle may obtain this information by contacting the BBU office and providing the registration number of these individuals or by using the search feature online at www.beefmasters.org.
Q. If a bull has no progeny recorded, how does he have an EPD?
A. The parents of that bull have enough records to generate his EPD for that trait.
Q. What impact will a genomics test have on my bulls EPDs and Accuracy?
A. There is no way to know whether a genomics test will increase or decrease a bull’s EPD for any trait. The increase or decrease will depend on the animal’s relationship to previously genotyped animals. However, a genomics test will definitely increase the animal’s accuracy for each EPD. This increase in accuracy is greater for unproven animals with lower accuracies, and has less of an impact on higher accuracy, proven animals.
For More Information Call BBU at 210-732-3132
1. Introduction
This Genetic Evaluation published by Beefmaster Breeders United (BBU) represents part of a comprehensive breed- wide genetic evaluation program available to breeders of Beefmaster cattle. This program provides genetic values in the form of Expected Progeny Differences (EPDs) for all animals — male and female — recorded on the BBU database with performance records of their own or progeny with performance records. This Genetic Evaluation contains bulls which have produced progeny with at least one weaning weight record. EPDs for all other animals included in the evaluation - such as cows with performance progeny or non—parent animals with performance records — are available from the BBU office and via the EPD search facility on the BBU website.
The BBU genetic evaluation calculates EPDs for individual animals using all available pedigree and performance information on the animal as well as its progeny and close relatives. The genetic evaluation takes into account the influence of management, environmental effects and other non-genetic effects as recorded by Beefmaster breeders, to provide the best possible estimate of an animal’s genetic value (ie. EPDs) for all traits evaluated.
EPDs are reported for a range of economically important traits including: birth weight, calving ease, 205-day weight, 365-day weight, maternal growth (milk), scrotal size and four ultra-sound scan traits (rib eye area, rib and rump fat, and intra-muscular fat percent). The trait EPDs reported do not represent the complete list of traits that must be considered during the selection of functional cattle. However, EPDs are the best figures available on the genetic value of animals for these economically important traits. They should be used in conjunction with assessment for structural soundness, fertility, mature size and temperament, among other traits, as part of a systematic and balanced cattle breeding program.
2. The Analysis
The EPDs published in this Genetic Evaluation were produced using Livestock Genetic Services’ Genetic Evaluation program. This software implements Genomic Best Linear Unbiased Prediction (GBLUP).
This evaluation is based on a wide range of information including the performance of the individual and its relatives for a number of traits, the genetic relationships between the traits and the pedigree links between animals and between herds. All information is combined into one multi-trait genetic evaluation of the Beefmaster breed.
i. The traits included
All performance traits included in the BBU genetic evaluation are adjusted for age of dam and age of calf effects, where such non-genetic effects have been shown to be a significant source of variation in performance for the trait.
Birth Weight
Actual birth weights are adjusted for age of dam effects using multiplicative adjustment factors derived from the BBU data. Birth weight EPDs indicate likely genetic differences between sires in progeny birth weights, after removing age of dam and contemporary group differences. The lower the birth weight EPD of a sire the lighter is the expected birth weight of his progeny.
Birth weight is of economic importance because it reflects calving ease to some degree, i.e. larger calves at birth tend to result in more difficult births, especially amongst first-calving females. However, whilst low birth weight EPDs may be favored for calving ease they are also generally associated with lower overall growth potential. Consequently, birth weight and growth need to be carefully balanced. Fortunately, animals can be found that have both moderate birth weight EPDs and above average EPDs for later growth.
Calving Ease Direct
Calving scores (from 1-5 with 1 being no assistance) are utilized to calculate this EPD. The adjusted birth weights are also fit in the model to assist in giving an estimate of calving ease.
The calving ease direct score is presented as the percent of an animal’s calves that will be born unassisted over the population average. Higher calving ease direct scores represent more unassisted births and are therefore considered superior. Note that this is opposite of the birth weight EPD in which lower EPDs generally represent fewer unassisted births.
Calving Ease Maternal
The calving ease maternal EPD again is based on adjusted birth weights and calving scores. This EPD is presented as the percent unassisted births a daughter will have over the population average. Again, a higher number represents fewer unassisted births.
205-day (Weaning) Weight
Actual weaning weights are adjusted for age of calf at weighing to a standard age of 205-days, and also adjusted for differences in age of dam, using multiplicative adjustment factors derived from the BBU data. This revised approach to adjusting for age at weighing no longer requires the use of a default birth weight if actual birth weight is unavailable and therefore reduces the risk of any bias that might occur.
The 205-day weight EPDs indicate likely genetic differences between sires in the growth of their progeny to weaning.
205-day Maternal Growth (i.e. Milk)
The BBU genetic evaluation partitions the genetic variation in 205-day weight into direct and maternal genetic components. That is, separating the effects of the genes for growth possessed by the calf itself from the effects of genes possessed by the dam for milking or mothering ability.
The 205-day maternal growth or milk EPD reflects extra calf weight that is due to the genetic influence a sire has on his daughters’ milking and mothering ability. These EPDs are reported in pounds of weaning weight. Sires with above average 205-day Milk EPDs are therefore expected
to sire daughters with above average milking potential. A sire’s 205-day Milk EPD is usually less accurate than its growth EPDs because of the lower heritability of the trait and the time lag before the performance of the daughter’s calves becomes
available.
A prediction of total contributions of a sire’s daughter to calf performance can be obtained by adding one half of the sire’s weaning weight EPD to his milk EPD.
365-day (Yearling) Weight
Actual yearling weights are adjusted for age of calf at weighing to a standard age of 365-days, and also adjusted for differences in age of dam, using multiplicative adjustment factors derived from the BBU data.
The 365-day weight EPDs indicate likely genetic differences between sires in progeny growth potential through to market age.
Scrotal Size
Actual scrotal circumference records, in centimeters, are adjusted for age of bull at measurement to a standard age of 365-days, and also adjusted for differences in age of dam, using multiplicative adjustment factors derived from the BBU data.
Scrotal size EPDs indicate likely genetic differences between sires in the fertility of their male progeny, which passes on in part to female relatives. Increased scrotal size is associated with increased fertility in male progeny and with earlier age at puberty of male and female progeny.
Stayability
Stayability (STAY) is defined as the probability a female would be reported as calving in the herd at age 5 or greater. A higher number is more favorable, indicating a female has a higher probability of remaining in the herd past 5 years of age.
Age at First Calf
Age at first calf (AFC) is defined as the difference between a cow's birthdate and the birthdate of her first calf. A lower number is more favorable, indicating a female that will calve at a younger age.
Residual Feed Intake
Residual Feed Intake (RFI) utilizes ultrasound measured rib fat in the calculation to help select for animals that will grow and maintain optimal condition. A lower RFI EPD is expected to eat less and be more efficient, when compared to an animal with a higher RFI EPD.
Rib Eye Area
Ultrasound scanning measurements of rib eye area are adjusted for age at scanning to a standard age of 380 days, using linear regression coefficients derived from the BBU data. These are applied separately for bulls and heifers. The effect of age of dam is also removed using multiplicative adjustment factors derived from the BBU data.
These EPDs indicate likely genetic differences between sires in rib eye area as measured in progeny at scanning. Sires with relatively higher EPDs are expected to produce better muscled and higher percentage yielding progeny at the same age than will sires with lower EPDs.
Intra Muscular Fat Percent
Intra muscular fat percent (IMF%), as measured using ultrasound scan technology, is adjusted for age at scanning to a standard age of 380 days, using linear regression coefficients derived from the BBU data. These are applied separately for bulls and heifers.
These EPDs indicate likely genetic differences between sires in the degree of intra muscular fat percentage (or marbling) in progeny at a constant age at scanning. Sires with positive EPDs are expected to produce progeny with higher IMF% when scanned at a constant age.
ii. Statistics
The following table provides some general statistics relating to the BBU genetic evaluation:
iii. The genetic parameters
All genetic parameters for growth, carcass, and scrotal circumference have remained unchanged since 2009. The genetic parameters for calving ease were estimated using the BBU data and will remain in place going forward.
iv. Contemporary Groups
One of the critical aspects of the BBU genetic evaluation is the use of contemporary groups to take out the influence of as many non-genetic effects as possible (eg. feeding, years, seasons). The underlying principle is that only animals that have had an equal opportunity to perform are directly compared together within each contemporary group. If the contemporary groups are not correctly formed, the EPDs calculated may be biased and misleading. Most of the problems that breeders encounter in “believing” their EPDs can be traced back to incorrect contemporary grouping — either calves being fragmented into isolated groups of only one or two animals (and thereby virtually eliminating those calves from any comparison with their peers) or by not differentiating between calves that have had different levels of management or feeding.
Importantly, the breeder has a major influence on deciding which animals will be directly compared within each contemporary group. This influence is through both their on farm management and the recording of management group information when submitting their performance data to the BBU office. It is therefore vital that breeders understand the factors that influence the formation of contemporary groups to ensure they maximize the effectiveness of their performance records and the accuracy of their EPDs. Providing management group information is the responsibility of the breeder. Animals should be assigned into different management or treatment groups in any situation when either individually or as a group, they have not had equal opportunity to perform. Differences in management or treatment may be deliberate, such as when young bulls receive supplementary feeding and others do not, or accidental (eg if a calf is sick).
The contemporary group for birth weight and calving ease is based on the following criteria: breeder herd; sex of calf; number in birth (single or twin); birth status (natural or ET); breeder-defined management group; and grade of calf. The contemporary groups are further sliced into 90 day windows to only allow calves born relatively close to each other be compared.
The contemporary group for weaning weight is based on the same criteria as birth weight with the addition of a whether the animal has been steered, and a 7 day window on weight date.
For all post-weaning traits, the previous contemporary group is also included in the definition of the current contemporary group. For example, bulls identified as being in different management groups for their weaning weights will automatically be assigned to different yearling weight contemporary groups even if they are run together as one group from weaning to their yearling weighing.
For yearling weights, 7 day date of measurement windows are used. All scan data and scrotal circumference are grouped by exact date of measurement.
Accuracy
It is impossible to predict with 100% certainty the genetic value of an animal and therefore the genetic value of the progeny of a particular mating. Therefore, by definition EPDs are estimates of genetic value. The accuracy of an EPD depends on two major factors:
![]() Non Parent
Non Parent
![]() Active Sires
Active Sires
![]() Active Dams
Active Dams
![]() Non Parent
Non Parent
![]() Active Sires
Active Sires
![]() Active Dams
Active Dams
![]() Genetic Trends Graphically
Genetic Trends Graphically
![]() Genetic Trends
Genetic Trends
![]() Trait Leaders
Trait Leaders
![]() Active Sires
Active Sires
![]() Young Sires
Young Sires
Click here to View Non Parent Breed Averages.
Click here to View Active Sires Parent Breed Averages.
Click here to View Active Dams Parent Breed Averages.
Click here to Non Parent Percentile Rank.
Click here to View Active Sires Percentile Rank.
Click here to View Active Dams Percentile Rank.
Click here to View Genetic Trends Graphically.
Click here to View Genetic Trends.
Click here to View Trait Leaders.
Click here to View Active Sires.
Click here to View Young Sires.
Click here for Complete Sire Summary.
Click here to View Foreword & Stats.
Click here to View Trait Leaders.
Click here to View Young Sires.
Click here to View Active Sires.
Click here for Complete Sire Summary.
Click here to View Foreword & Stats.
Click here to View Trait Leaders.
Click here to View Young Sires.
Click here to View Active Sires.
Click here for Complete Sire Summary.
Click here to View Foreword & Stats.
Click here to View Trait Leaders.
Click here to View Young Sires.
Click here to View Active Sires.
Click here to View Foreword & Stats.
Click here to View Trait Leaders.
Click here to ViewYoung Sires.
Click here to View Active Sires.
Click here to View Foreword & Stats.
Click here to View Trait Leaders.
Click here to View Young Sires.
Click here to View Active Sires.
Click here to View Foreword & Stats.
Click here to View Trait Leaders.
Click here to View Young Sires.
Click here to View Active Sires.
Click here to View Foreword & Stats.
Click here to View Trait Leaders.
Click here to View Young Sires.
Click here to View Active Sires.
Click here to View Foreword & Stats.
Click here to View Trait Leaders.
Click here to View Young Sires.
Click here to View Active Sires.
Click here to View Foreword & Stats.
Click here to View Trait Leaders.
Click here to View Young Sires.
Click here to View Active Sires.
Click here to View Foreword & Stats.
Click here to View Trait Leaders.
Click here to View Young Sires.
Click here to View Active Sires.
Click here to View Foreword & Stats.
Click here to View Trait Leaders.
Click here to View Young Sires.
Click here to View Active Sires.
Click here to View Foreword & Stats.
Click here to View Trait Leaders.
Click here to View Young Sires.
Click here to View Active Sires.